 |
|
Epidemiology is critical
for organizing and planning health services and targeting specific
interventions. This module provides a refresher on the foundations of
epidemiology. It covers the measures of frequency that include count,
prevalence, and incidence in public health practice. It concludes by discussing
descriptive epidemiology, which answers the questions what, who, when, and
where about health events. Completing this module will improve your knowledge
on descriptive data analysis, which is used to assess population health,
identifying whether health issues are increasing or decreasing, where they are
occurring most, and who are the most affected. |
|
|
 |
|
This module explores measures of association that are used to compare groups of different people, groups across different places, or one group over time. Age-standardized data is often required when making such comparisons. The module therefore also provides an explanation of when standardization of public health data is important and how to age-standardize data. It concludes by providing details on more complex measures of potential impact, including population attributable fraction and excess mortality. Completing this module will improve your knowledge of the importance of comparing groups in epidemiology, as this helps to identify populations most affected by poor health. The population attributable fraction is then used to estimate the reduction in disease due to the removal of harmful exposures or the implementation of beneficial public health interventions.
|
|
|
 |
|
Completing this module will increase your understanding of what public health data are collected, how they are collected, and how they are used for planning and programming of health services, monitoring of services and health status, and evaluation of interventions. This module provides an overview of the types and sources of public health data. The strengths and limitations of the various sources of data are also covered, as these need to be considered when using data for planning and policymaking. Further explanation is provided on how public health data are used. Monitoring and evaluation of health programs are also covered, as these are important uses of health data.
|
|
|
 |
|
The goal of a visualization is to allow the data to tell a story. They can help to communicate a message to your reader that may be difficult to convey in a table. The module commences with the type of data stories that can be told, as this helps you define the message you want to communicate (e.g., change, comparison, composition, or correlation). The next step is to select the most appropriate visualization based on your communication purpose and the characteristics of your data. The module then covers the most important principles that should be considered when designing a visualization. The final section discusses the purpose of the maps and the types of maps that are used to share public health information. Completing this module will provide you with the knowledge of how to select and design the best visualization to tell your story.
|
|
|
 |
|
Measuring the burden of disease helps clarify the impact of a health problem in a particular population or setting. Summary measures, such as disability-adjusted life years, are used to estimate the burden of diseases on population health. This module will introduce the different measures, describe how they are calculated, and provide you with an understanding of their limitations. By completing this module, you will understand how to estimate the impact of a health problem by measuring the burden of disease when comparing groups.
|
|
|
 |
|
Understanding the social determinants of health and inequalities in a setting can help identify where health inequities exist, inform resource allocation, and tailor public health programs. This module begins with the social determinants of health and how they influence and affect health outcomes. Health inequalities and inequities are then described, and data from the World Health Organization Health Equity Assessment Toolkit (HEAT) are used to present and calculate measures of inequality. By completing this module, you will gain an understanding of health inequalities and inequities, and how to assess these for a given population.
|
|
|
 |
|
Large amounts of health data are collected by governments. Although
some analysis of the data is usually done, the data are not always used in
decision-making. This module provides an understanding of public health data
and how it is used to inform public health planning, resource allocation, and policymaking.
It provides government staff with a framework for improving the use of data for
decision-making. Completing this module will help you develop a structured
approach for making data-driven
decisions to improve population health.
|
|
|
 |
|
Data should not be analyzed without careful error checking and reflection on the quality. Incorrect assumptions or misinterpretations due to poor assessment of the data can result in a wrong decision or action, which could have detrimental health effects as well as potentially waste funds that could be used more fruitfully. The module provides you with an approach for assessing routine public health data and managing data quality issues.
|
|
|
 |
|
La epidemiología
es fundamental para organizar y planificar los servicios de salud y orientar
intervenciones específicas. En este módulo se proporciona un repaso de los
fundamentos de la epidemiología. Se abarcan las medidas de frecuencia que
incluyen recuento, prevalencia e incidencia en la práctica de la salud pública.
Al final se debate la epidemiología descriptiva, que responde a las preguntas
qué, quién, cuándo y dónde de los eventos de salud. Al completar este módulo
mejorará su conocimiento sobre el análisis de datos descriptivos, que se
utiliza para evaluar la salud de la población, identificará si los problemas de
salud están aumentando o disminuyendo, dónde ocurren más y quiénes son los más
afectados. |
|
|
 |
|
En este módulo se exploran las medidas de asociación que se utilizan para comparar grupos de diferentes personas, grupos en diferentes lugares o un grupo a lo largo del tiempo. A menudo se requieren datos estandarizados por edad cuando se hacen tales comparaciones. Por lo tanto, en el módulo también se ofrece una explicación de cuándo es importante la estandarización de los datos de salud pública y cómo estandarizar los datos por edades. Al final se proporcionan detalles sobre medidas más complejas de impacto potencial, incluida la fracción atribuible a la población y el exceso de mortalidad. Al completar este módulo mejorará su conocimiento sobre la importancia de comparar grupos en epidemiología, ya que esto ayuda a identificar las poblaciones más afectadas por la mala salud. La fracción atribuible a la población se usa luego para estimar la reducción de la enfermedad debido a la eliminación de exposiciones dañinas o la implementación de intervenciones de salud pública beneficiosas.
|
|
|
 |
|
Al completar este módulo aumentará su comprensión de qué datos de salud pública se recopilan, cómo se recopilan y cómo se utilizan para la planificación y programación de los servicios de salud, el seguimiento de los servicios, y el estado de salud y la evaluación de las intervenciones. En este módulo se proporciona una descripción general de los tipos y fuentes de datos de salud pública. También se abordan los puntos fuertes y las limitaciones de las diversas fuentes de datos, ya que deben tenerse en cuenta al utilizar los datos para la planificación y la formulación de políticas. Se proporciona una explicación más detallada sobre cómo se utilizan los datos de salud pública. También se cubren el monitoreo y la evaluación de los programas de salud, ya que estos son usos importantes de los datos de salud.
|
|
|
 |
|
El objetivo de una visualización es permitir que los datos cuenten una historia. Pueden ayudar a comunicar un mensaje a su lector que puede ser difícil de transmitir en una tabla. El módulo comienza con el tipo de historias de datos que se pueden contar, ya que esto lo ayuda a definir el mensaje que desea comunicar (p. ej., cambio, comparación, composición o correlación). El siguiente paso es seleccionar la visualización más adecuada en función de su objetivo de comunicación y las características de sus datos. Luego, en el módulo se cubren los principios más importantes que deben tenerse en cuenta al diseñar una visualización. En la sección final se analizan el objetivo de los mapas y los tipos de mapas que se utilizan para compartir información de salud pública. Al completar este módulo sabrá cómo seleccionar y diseñar la mejor visualización para contar su historia.
|
|
|
 |
|
Medir la carga de la enfermedad ayuda a aclarar el impacto de un problema de salud en una población o entorno en particular. Las medidas de resumen, como los años de vida ajustados por discapacidad, se utilizan para estimar la carga de enfermedades en la salud de la población. En este módulo se presentarán las diferentes medidas, se describirá cómo se calculan y se le proporcionará una comprensión de sus limitaciones. Al completar este módulo, comprenderá cómo estimar el impacto de un problema de salud al medir la carga de la enfermedad al comparar grupos.
|
|
|
 |
|
Comprender los determinantes sociales de la salud y las desigualdades en un entorno puede ayudar a identificar dónde existen las desigualdades en salud, informar la asignación de recursos y adaptar los programas de salud pública. Este módulo comienza con los determinantes sociales de la salud, y cómo influyen y afectan los resultados de salud. Luego se describen las desigualdades e inequidades en salud, y se utilizan datos de la Caja de Herramientas para la Evaluación de la Equidad en Salud (HEAT) de la Organización Mundial de la Salud para presentar y calcular medidas de desigualdad. Al completar este módulo, comprenderá las desigualdades e inequidades en salud y cómo evaluarlas para una población determinada.
|
|
|
 |
|
Los gobiernos recopilan grandes cantidades de datos de salud. Aunque generalmente se realiza algún análisis de los datos, los datos no siempre se utilizan en la toma de decisiones. En este módulo se proporciona una comprensión de los datos de salud pública y cómo se utilizan para informar la planificación de la salud pública, la asignación de recursos y la formulación de políticas. Proporciona al personal del gobierno un marco para mejorar el uso de los datos para la toma de decisiones. Completar este módulo lo ayudará a desarrollar un enfoque estructurado para tomar decisiones basadas en datos para mejorar la salud de la población.
|
|
|
 |
|
Los datos no deben analizarse sin una cuidadosa verificación de errores y una reflexión sobre la calidad. Las suposiciones incorrectas o las malas interpretaciones debido a una evaluación deficiente de los datos pueden dar lugar a una decisión o acción incorrecta, lo que podría tener efectos perjudiciales para la salud y potencialmente desperdiciar fondos que podrían usarse de manera más fructífera. En el módulo se le proporciona un enfoque para evaluar los datos de salud pública de rutina y gestionar los problemas de calidad de los datos.
|
|
|
 |
|
This electronic course on medical certification of cause of death will help physicians and other health care staff to understand the critical importance of medical certification. This will allow them to produce high quality mortality data for government agencies to effectively make evidenced-based policy decisions.
|
|
|
 |
|
L’épidémiologie est essentielle pour l’organisation et la planification des services de santé et le ciblage d’interventions précises. Ce module permet de remettre à niveau les bases de l’épidémiologie. Il couvre les mesures de fréquence qui comprennent le dénombrement, la prévalence et l’incident dans la pratique de la santé publique. Il se termine par une discussion sur l’épidémiologie descriptive qui répond aux questions « quoi, qui, quand et où » concernant les phénomènes de santé. À l’issue de ce module, vous améliorerez vos connaissances sur l’analyse des données descriptives qui sert à évaluer la santé de la population, en déterminant si les problèmes de santé augment ou diminuent, là où ils se produisent le plus et quelles sont les personnes les plus touchés. |
|
|
 |
|
La seguridad vial es uno de los elementos mas significativos en torno a la operación de la infraestructura, la movilidad y el comportamiento de los diferentes actores viales de las ciudades. La siniestralidad vial contribuye de manera sustancial a la
morbilidad y mortalidad de la población y el conocimiento de la magnitud y circunstancias de estos eventos es necesario para orientar la toma de decisiones relacionadas a la aplicación de normas que regulan la movilidad de un país, así como a través de
la concientización y de la educación de todos los actores que intervienen en las vías. Tomando la perspectiva de salud pública, este curso proporciona elementos sobre el análisis, interpretación y presentación de datos de seguridad vial, así como de los
indicadores de siniestralidad vial definidos para el país de Colombia, a partir de fuentes de información existentes, que permitan la generación de líneas base para la toma de decisiones en el diseño e implementación de intervenciones efectivas y basadas
en la evidencia. |
|
|
 |
|
Ce module explore
les mesures d’association qui sont utilisées pour comparer des groupes de
personnes différentes, des groupes dans différents lieux ou un groupe dans le
temps. Des données normalisées en termes d’âge sont souvent nécessaires pour
effectuer de telles comparaisons. Le module explique donc également quand la
normalisation des données de santé publique est importante et comment
normaliser les données en fonction de l’âge. Il se termine par des informations
sur des mesures plus complexes de l’impact potentiel, notamment la fraction
attribuable dans la population et la surmortalité. En étudiant ce module, vous
renforcerez vos connaissances sur l’importance de la comparaison des groupes en
épidémiologie, car cela permet d’identifier les populations les plus affectées
par une détérioration de la santé. La fraction attribuable dans la population
est ensuite utilisée pour estimer la réduction des maladies dues à
l’élimination des expositions nocives ou à la mise en œuvre d’interventions de
santé publique bénéfiques. |
|
|
 |
|
En complétant ce
module, vous comprendrez mieux quelles données de santé publique sont
collectées, comment elles sont collectées et utilisées pour la planification et
la programmation des services de santé, le suivi des services et l’état de
santé et l’évaluation des interventions. Ce module offre une description des
types et sources de données de santé publique. Les points forts et les limites
des diverses sources de données sont également abordés, car ils doivent être
pris en compte lors de l’utilisation des données pour la planification et
l’élaboration des politiques. Des
explications supplémentaires sont données sur l’utilisation des données de
santé publique. Le suivi et l’évaluation des programmes de santé sont également
couverts car il s’agit d’utilisations importantes des données de santé. |
|
|
 |
|
L’objectif d’une
visualisation est de permettre aux données de raconter une histoire. Elles
peuvent contribuer à communiquer un message à votre lecteur qui peut être
difficile à communiquer avec un tableau. Le module commence par le type
d’histoires de données susceptibles d’être racontées, car cela vous aide à
définir le message que vous souhaitez communiquer (par exemple changement,
comparaison, composition ou corrélation).
L’étape suivante consiste à sélectionner la visualisation la plus
adaptée en fonction de votre objectif de communication et des caractéristiques
de vos données. Le module couvre ensuite les principes les plus importants à
prendre en compte lors de la conception d’une visualisation. La dernière section traite de l’objectif des
cartes et des types de cartes qui sont utilisées pour transmettre des
informations sur la santé publique. À l’issue de ce module, vous saurez comment
sélectionner et concevoir la meilleure visualisation pour raconter votre
histoire. |
|
|
 |
|
La mesure de la
charge de morbidité permet de clarifier l’impact d’un problème de santé dans
une population ou un cadre particulier.
Des mesures synthétiques, telles que les années de vie corrigées en
fonction de l’incapacité, sont utilisées pour estimer la charge de morbidité
sur la santé de la population. Ce module présente les différentes mesures, décrit leur mode de calcul et vous
permet de comprendre leurs limites. À l’issue de ce module, vous comprendrez
comment estimer l’impact d’un problème de santé en mesurant la charge de
morbidité lorsque vous comparez des groupes. |
|
|
 |
|
Comprendre les
déterminants sociaux de la santé et les inégalités dans un milieu peut
contribuer à déterminer où existent les inégalités en matière de santé, à
guider l’allocation des ressources et à adapter les programmes de santé
publique. Ce module commence par les déterminants sociaux de la santé et la
façon dont ils influencent et affectent les résultats de santé. Les inégalités
et les iniquités en matière de santé sont ensuite décrites, et les données du
Health Equity Assessment Toolkit (HEAT) de l’Organisation mondiale de la santé
sont utilisées pour présenter et calculer les mesures de l’inégalité. À l’issue de ce module, vous comprendrez les
inégalités et les iniquités en matière de santé et vous saurez comment les
évaluer pour une population donnée. |
|
|
 |
|
De grandes quantités de données de santé sont recueillies par les pouvoirs publics. Bien qu’une partie de l’analyse des données soit généralement effectuée, les données ne sont pas toujours utilisées pour prendre des décisions. Ce module permet de comprendre les données de santé publique et la manière dont elles sont utilisées pour guider la planification de la santé publique, l’allocation des ressources et l’élaboration des politiques. Il offre aux employés du service public un cadre pour améliorer l’utilisation des données pour la prise de décision. Ã l’issue de ce module, vous pourrez adopter une approche structurée pour prendre des décisions fondées sur les données afin d’améliorer la santé de la population. |
|
|
 |
|
Il ne faut pas analyser les données sans avoir vérifier avec soin les erreurs et réfléchi à la qualité de ces données. Des hypothèses incorrectes ou des interprétations erronées dues à une mauvaise évaluation des données peuvent entraîner une décision ou une action erronée, susceptible d’avoir des effets néfastes sur la santé et de gaspiller des fonds qui pourraient être utilisés de manière plus fructueuse. Ce module vous propose une approche d’évaluation des données de santé publique de routine et la gestion des problèmes de qualité des données. |
|
|
 |
|
As data become more prevalent and accessible, good reporting on civil registration and vital statistics (CRVS)—at the community, national, and global levels—requires journalists who can understand and use data. This e-learning course builds the data use
skills of journalists to develop stories related to CRVS. The course will provide a detailed overview of CRVS—what it is and why it is important, including for human rights and equity—and build skills related to data use in reporting. Topics covered
include: common data-related terms and concepts; primary sources of CRVS data; basic methods for analyzing, interpreting, and visualizing CRVS data; and effective tactics for interviewing public health experts and leaders about data-rich topics. This
course is designed for journalists who write about public health topics, and participants will be guided in developing a CRVS-related data story for publication.
|
|
|
 |
|
Well-written, accurate, and accessible reports are critical tools for communicating public health data and for advancing policies that are responsive to the issues data reveal. All public health agencies should produce data reports and tailor them to a variety of audiences. This short course provides guidance on writing data reports, suggestions on how and when to produce specific kinds of reports, and ideas to help organizations assess their report-writing needs. The course is designed for surveillance and epidemiology staff who wish to communicate data to external audiences, and also to communications staff who wish to incorporate data into ministry or health department communications products or websites.
|
|
|
 |
|
Cette formation en ligne sur la certification des causes médicales de décès vise à aider les médecins et le reste du personnel de santé à comprendre l’importance capitale de la certification des causes médicales de décès. Cela leur permettra de fournir des données de haute qualité sur la mortalité aux organismes gouvernementaux afin qu’ils puissent prendre des décisions politiques fondées sur des données probantes. |
|
|
 |
|
The CRVS Systems Improvement Framework provides countries with the tools to assess and improve their CRVS systems and processes that brings stakeholders together to solve problems. The Framework's purpose is to guide the analysis, redesign, and monitoring of the business processes that are at the foundation of CRVS systems. For example, these include the review, revision, and measurement of end-to-end activities for registering births and deaths, and assigning causes of death for vital events occurring both in and outside of health facilities. The course provides detailed and interactive learning materials to build skills to apply resources and tools from the framework. This self-guided e-learning course is designed to help CRVS system planners and administrators implement the Framework. There are three modules that complement the framework. |
|
|
 |
|
This course, titled Introduction to CRVS Systems Improvement Framework, provides a key learning opportunity for the strengthening of civil registration and vital statistics (CRVS) systems in low- and middle-income countries and for enhancing CRVS systems processes. It offers a strong introduction to the Framework and provides the insight needed to support system improvement. This module is suited for senior government officials, policymakers, or development partners who support CRVS systems strengthening who may not need the level of detail offered in the Full Learning Program.
|
|
|
 |
|
The Communication for Development e-learning Course has been developed for Civil Registration and Vital Statistics (CRVS) practitioners interested in learning how to apply communication for development approaches to achieve timely, effective, and universal civil registration of vital events. The course comprises six self-learning modules and takes about 3-4 hours to complete.
|
|
|
 |
|
This module forms part of a course on the analysis and use of vital
statistics and is available in English, Français, Português, and
Español.
Accurate civil registration and vital statistics (CRVS) data are critical to understanding national health status and developing appropriate strategies and relevant policies to improve population health. In the absence of CRVS data, countries lack a clear picture of birth and death rates and the causes of death. This data gap makes it difficult to allocate resources appropriately to health, education, and other key government sectors. As part of the Bloomberg Philanthropies Data for Health Initiative, countries around the world are investing in expanding and improving the quality of the CRVS systems. However, unless data are regularly analyzed and used, neither government nor citizens will not reap the benefits of this investment. Vital statistics generated by well-functioning civil registration systems are crucial for policy development and decision-making and are central to monitoring several Sustainable Development Goal (SDG) targets. Here in Module 1 of 12, you'll get an overview of CRVS and the social and health benefits from high-quality data from civil registration records. Participants will learn about the public health uses of data from CRVS systems, including developing public health policies, monitoring health systems, and evaluating public health programs. Upon completion of the module, participants will understand how to define civil registration and vital statistics, the types of vital records recognized by the UN, and both the challenges and benefits of CRVS systems.
|
|
|
 |
|
This module forms part of a course on the analysis and use of vital statistics and is available in English, Français, Português, and Español.
During Module 3, participants will understand how low-quality data can adversely affect the accuracy of vital statistics. The module reviews methods (both direct and indirect) on estimating the completeness of birth and death registration and how to assess the plausibility of mortality measures. Participants will also learn about the importance of high-quality cause-of-death data and how this data can be assessed, using tools such as ANACoD3 or ANACONDA.
|
|
|
 |
|
This module forms part of a course on the analysis and use of vital statistics and is available in English, Français, Português, and Español.
This module
introduces birth statistics that are important for monitoring, tracking
Sustainable Development Goals, reporting, and understanding the fertility
trends in a country. Upon completion of the module, participants will know how
to calculate birth statistics such as sex ratio, crude birth rate, and total
fertility rate, which are important to report on in a national vital statistics
report. |
|
|
 |
|
This module forms part of a course on the analysis and use of vital statistics and is available in English, Français, Português, and Español.
The module on death statistics provides an overview of mortality measures that are important for monitoring, tracking Sustainable Development Goals, reporting, and understanding the mortality trends in a country. These measures include: the crude death rate, age-specific mortality rates, under-5 mortality rate, and the infant mortality rate. Participants will learn about the importance of age standardization to account for the differing age distributions across populations. Finally, participants will be introduced to how to calculate key mortality measures using life tables. |
|
|
 |
|
This module forms part of a course on the analysis and use of vital statistics and is available in English, Français, Português, and Español.
Upon completion of this module, participants will understand how cause of death (COD) data are generated, including the sources of COD data, and how to conduct basic analyses of this data. Participants will also learn why COD data are important for various stakeholders (e.g., agencies, researchers, medical practitioners) and how COD data can be used. Finally, the module will provide an overview of verbal autopsy, which is used to ascertain cause of death and cause-specific mortality fractions when medical certification of cause of death (MCCD) is unavailable. |
|
|
 |
|
This module forms part of a course on the analysis and use of vital statistics and is available in English, Français, Português, and Español.
Module
6 will help participants understand how to use descriptive epidemiology to
assess and interpret vital statistics. This will include using epidemiological
topics such as rate difference and rate ratio to compare and make meaning of
vital statistics. Participants will gain an understanding of inequalities in
mortality when disaggregating vital statistics by demographic factors and learn
how to calculate and interpret excess mortality, an important concept to the
COVID-19 pandemic. |
|
|
 |
|
This module forms part of a course on the analysis and use of vital statistics and is available in English, Français, Português, and Español.
Upon
completion of this module, participants will be able to describe and compare
the main types of visualizations used to depict vital statistics and understand
the factors involved in determining which visualization best suits a
communication purpose. Participants will also understand important design
principles that contribute to effective data visualization.
|
|
|
 |
|
This module forms part of a course on the analysis and use of vital statistics and is available in English, Français, Português, and Español.
In
this module, participants will dive deeper into how CRVS data can be applied to
calculate epidemiological measures such as attributable mortality, years of
life lost (YLL), and measures to assess the burden of disease. |
|
|
 |
|
This module forms part of a course on the analysis and use of vital statistics and is available in English, Français, Português, and Español.
This session provides an overview of how to identify and communicate findings to a targeted audience and how to identify the best way to communicate the message. Participants will learn about different types of analytical reports, including national vital statistics reports, that can be produced to disseminate vital statistics and learn about other types of media, such as press release, to communicate findings. |
|
|
 |
|
This module forms part of a course on the analysis and use of vital statistics and is available in English, Français, Português, and Español.
Upon completion of this module, participants will understand how vital statistics can be used to inform policy decisions, program planning, and program evaluation. Participants will hear about examples of where CRVS indicators such as cause-specific mortality and infant mortality rate were used to identify a problem and evaluate a program. |
|
|
 |
|
This webisode provides an overview of how to use indirect methods to calculate the denominator and numerator to assess birth and death registration completeness. A demonstration of a completeness calculator using sample country data is provided.
|
|
|
 |
|
In this webisode, participants will receive an overview of verbal autopsy (VA) and learn how VA can be used for population-level cause of death reporting.
|
|
|
 |
|
In this webisode, participants will learn the calculation and use of excess mortality to understand the impact of an event on mortality, specifically the COVID-19 pandemic.
|
|
|
 |
|
This webisode reviews design principles important for developing effective visualizations using CRVS data. These visualizations can then be used in CRVS reporting, such as in a vital statistics report or online dashboard. Participants will watch a demonstration of how to use design principles to make a visualization more effective.
|
|
|
 |
|
This webisode provides an overview of the Vital Statistics Report resource kit, which includes a Guide, Template, and Excel Workbook to help develop a vital statistics report. |
|
|
 |
|
The value of a public health report is achieved when the information registers and is internalized by the appropriate audiences and catalyzes positive action. Making sure that public health reports are seen by the intended audiences is a critical step in the report production process. Dissemination activities need to be considered as a step in the report production process to ensure that enough resources, including time, personnel, budget and expertise, are allocated to these tasks. This short course was developed to provide strategic guidance on developing an overall dissemination strategy and best practices on distilling key messages and communicating findings from reports to the intended audiences. The course is designed for surveillance and epidemiology staff who wish to communicate data to external audiences, and also to communications staff who wish to incorporate data into ministry or health department communications products or websites.
This course is available in English, Français, and Español.
|
|
|
 |
|
This module is part of the Data to Policy program, Unit 1 (Problem and Policy Analysis). After completing this module, participants will be able to:
- Define "policy" and "policy brief"
- Explain how health policy is formed
- Describe the components of a policy brief
For more information on the Data to Policy program, visit https://learning.vitalstrategies.org/data-to-policy/ |
|
|
 |
|
This module is part of the Data to Policy program, Unit 1 (Problem and Policy Analysis). After completing this module, participants will be able to:
- Identify various sources of data for your policy brief
- Use PubMed to access scientific literature
- Use Google Scholar and other sources to access literature and reports
- Use specific terms to refine your searches
For more information on the Data to Policy program, visit https://learning.vitalstrategies.org/data-to-policy/ |
|
|
 |
|
This module is part of the Data to Policy program, Unit 1 (Problem and Policy Analysis). After completing this module, participants will be able to:
- Frame a policy topic in terms of the health problem, primary cause and root causes
- Create a cause/effect "fishbone" diagram to analyze the root cause(s) of a problem
- Identify and prioritize high-impact, modifiable causes as targets of a policy brief
For more information on the Data to Policy program, visit https://learning.vitalstrategies.org/data-to-policy/ |
|
|
 |
|
This module is part of the Data to Policy program, Unit 1 (Problem and Policy Analysis). After completing this module, participants will be able to:
- Identify and map stakeholders
- Prioritize and plan for stakeholder interviews/engagement
- Conduct stakeholder analysis
For more information on the Data to Policy program, visit https://learning.vitalstrategies.org/data-to-policy/ |
|
|
 |
|
This module is part of the Data to Policy program, Unit 3 (Policy Advocacy and Communications). After completing this module, participants will be able to:
- Write for your audience or stakeholders
- Be aware of common errors of grammar and syntax to avoid
- Understand techniques that can be used to craft clear, concise sentences and paragraphs
For more information on the Data to Policy program, visit https://learning.vitalstrategies.org/data-to-policy/ |
|
|
 |
|
This module is part of the Data to Policy program, Unit 3 (Policy Advocacy and Communications). After completing this module, participants will be able to:
- Identify the information that should be included in your problem statement
- Provide relevant feedback on a problem statement
For more information on the Data to Policy program, visit https://learning.vitalstrategies.org/data-to-policy/ |
|
|
 |
|
This module is part of the Data to Policy program, Unit 3 (Policy Advocacy and Communications). After completing this module, participants will be able to:
- Summarize effective interventions, accounting for all aspects of feasibility
- Visually display the options in a way that clearly makes the case for one option over others
- Evaluate policy option sections within briefs
For more information on the Data to Policy program, visit https://learning.vitalstrategies.org/data-to-policy/ |
|
|
 |
|
This module is part of the Data to Policy program, Unit 3 (Policy Advocacy and Communications). After completing this module, participants will be able to:
- Identify the components of a good recommendation
- Write a compelling recommendation and call to action
For more information on the Data to Policy program, visit https://learning.vitalstrategies.org/data-to-policy/ |
|
|
 |
|
This module is part of the Data to Policy program, Unit 3 (Policy Advocacy and Communications). After completing this module, participants will be able to:
- Describe what makes a good key messages section
- Distill your policy brief content down to 2-3 key messages
- Describe what makes a good title
- Develop an effective title for your policy brief
For more information on the Data to Policy program, visit https://learning.vitalstrategies.org/data-to-policy/ |
|
|
 |
|
This module is part of the Data to Policy program, Unit 3 (Policy Advocacy and Communications). After completing this module, participants will be able to:
- Analyze the policy and advocacy environment
- Describe ways you can advocate for policy change
- Present your policy brief PowerPoint effectively
- Develop an effective elevator pitch
For more information on the Data to Policy program, visit https://learning.vitalstrategies.org/data-to-policy/ |
|
|
 |
|
This module is part of the Data to Policy program, Unit 1 (Problem and Policy Analysis). After completing this module, participants will be able to:
- Recognize why implementation and enforcement are important to consider during policy design
- Identify different mechanisms that can be used to achieve behavior change
- Assess when sanctions are appropriate for policy enforcement
- Consider how various factors could influence implementation and enforcement of your policy options
For more information on the Data to Policy program, visit https://learning.vitalstrategies.org/data-to-policy/ |
|
|
 |
|
This module is part of the Data to Policy program, Unit 2 (Economic Evaluation of Policy). After completing this module, participants will be able to:
- Define economic evaluation and its components
- Understand the benefits of economic evaluation methods for public health decision-making
- Apply key economic evaluation concepts, such as time frame, analytic horizon, and perspective to your policy topic
For more information on the Data to Policy program, visit https://learning.vitalstrategies.org/data-to-policy/ |
|
|
 |
|
This module is part of the Data to Policy program, Unit 2 (Economic Evaluation of Policy). After completing this module, participants will be able to:
- Understand why models are used in public health
- Construct a decision tree model
- Calculate expected value
For more information on the Data to Policy program, visit https://learning.vitalstrategies.org/data-to-policy/ |
|
|
 |
|
This module is part of the Data to Policy program, Unit 2 (Economic Evaluation of Policy). After completing this module, participants will be able to:
- Understand the concept of opportunity cost
- Define program cost analysis and cost of illness analysis
- Develop a cost inventory for your proposed interventions
For more information on the Data to Policy program, visit https://learning.vitalstrategies.org/data-to-policy/ |
|
|
 |
|
This module is part of the Data to Policy program, Unit 2 (Economic Evaluation of Policy). After completing this module, participants will be able to:
- Describe the basic concepts of a full economic evaluation
- Define the most common economic evaluation methods and identify when to use them
- Understand why we discount future costs and benefits
For more information on the Data to Policy program, visit https://learning.vitalstrategies.org/data-to-policy/ |
|
|
 |
|
This module is part of the Data to Policy program, Unit 2 (Economic Evaluation of Policy). After completing this module, participants will be able to:
- Recognize the value of sensitivity analysis
- Identify and test model inputs and assumptions using sensitivity analysis
- Present the findings of sensitivity analysis
For more information on the Data to Policy program, visit https://learning.vitalstrategies.org/data-to-policy/ |
|
|
 |
|
This module is part of the Data to Policy program, Unit 1 (Problem and Policy Analysis). After completing this module, participants will be able to:
- Describe how gender affects health status as well as the policy environment
- Use gender analysis to analyze a health problem and policy options
For more information on the Data to Policy program, visit https://learning.vitalstrategies.org/data-to-policy/ |
|
|
 |
|
This module is part of the Data to Policy program, Unit 1 (Problem and Policy Analysis). After completing this module, participants will be able to:
- Develop policy options that address root causes
- Analyze feasibility of policy options
- Identify evidence to assess options
For more information on the Data to Policy program, visit https://learning.vitalstrategies.org/data-to-policy/ |
|
|
 |
|
This module is part of the Data to Policy program, Unit 3 (Policy Advocacy and Communications). After completing this module, participants will be able to:
- Identify the most appropriate visualization types for your data stories
- Identify types and limitations of health data mapping
- Use guidelines to create the most effective visualizations for your policy brief and presentations
For more information on the Data to Policy program, visit https://learning.vitalstrategies.org/data-to-policy/ |
|
|
 |
|
This module is part of the Data to Policy program, Unit 1 (Problem and Policy Analysis). After completing this module, participants will be able to:
- Define epidemiology and explain its application in public health
- Define, calculate and interpret measures of frequency
For more information on the Data to Policy program, visit https://learning.vitalstrategies.org/data-to-policy/ |
|
|
 |
|
This module is part of the Data to Policy program, Unit 1 (Problem and Policy Analysis). After completing this module, participants will be able to:
- Identify and interpret advanced epidemiological measures used in the public health literature
- Use epidemiological measures to compare groups in your policy brief
For more information on the Data to Policy program, visit https://learning.vitalstrategies.org/data-to-policy/ |
|
|
 |
|
This course is available in English and French. This 5-hour course consists of 3 main modules and covers most of the content of the guidance titled: "Health Sector Contributions Towards Improving the Civil
Registration of Births and Deaths in Low-Income Countries" published by the WHO and UNICEF in 2021. The course aims to enable birth and death registration by capitalizing on the health sector's reach and service delivery. It is directed to the following two categories (1) Mid-level managers and policymakers, who have the capacity to drive positive change toward building the needed connection between the health sector and the Civil Registration and Vital Statistics (CRVS) system; (2) On-the-ground technical staff, who need specific knowledge, skills and competencies to undertake the desired change and implement the different connection potentials in practice. |
|
|
 |
|
This module forms part of a course on the analysis and use of vital statistics and is available in English, Français, Português, and Español.
This module introduces marriage and divorce statistics that are important for monitoring, tracking Sustainable Development Goals, reporting, and understanding trends in a country. Upon completion of the module, participants will know how to calculate statistics such as the crude marriage and divorce rates, and the age-specific divorce rate. |
|
|
 |
|
This module forms part of a course on the analysis and use of vital statistics and is available in English, Français, Português, and Español.
This module defines key concepts such as equality and equity and highlights how CRVS data can be used to expose inequalities and inequities. Participants will also learn about the key steps in conducting an inequality assessment. |
|
|
 |
|
This self-paced course builds practical skills in cleaning and preparing birth registration data for the production of vital statistics. Designed for national civil registration and vital statistics stakeholders, it guides learners through the basic steps of data cleaning to improve the quality and usability of their data. Through interactive modules, participants will learn how to check for missing or implausible values, standardize data entries, create new variables and assess the timeliness of birth registration. The course also introduces basic techniques for tabulating data by key variables such as year, sex and maternal age group. It includes practical demonstrations in Excel, with equivalent syntax provided in Stata, SAS, and R. By the end of the course, participants will be better equipped to clean and manage birth registration data in line with international standards. |
|
|
 |
|
This self-paced course builds practical skills in cleaning and preparing death registration data for the production of vital statistics. Designed for national civil registration and vital statistics stakeholders, it guides learners through the basic steps of data cleaning to improve the quality and usability of their data. Through interactive modules, participants will learn how to check for missing or implausible values, standardize data entries, create new variables and assess the timeliness of death registration. The course also introduces basic techniques for tabulating data by key variables such as year, sex, and age group. It includes practical demonstrations in Excel, with equivalent syntax provided in Stata, SAS, and R. By the end of the course, participants will be better equipped to clean and manage death registration data in line with international standards. |
|
|
 |
|
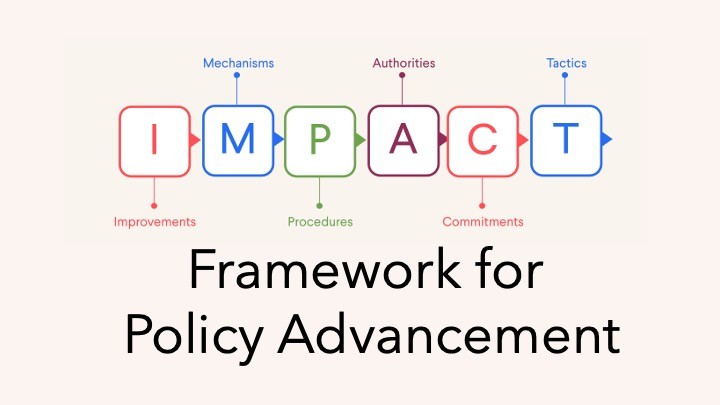
This module helps participants define specific, actionable system changes, so they can align on precise fixes that address the root cause of the problem. |
|
|
 |
|
This module explores the legal and administrative instruments available to enact improvements, so participants can choose the most effective and appropriate policy vehicle. |
|
|
 |
|
This module outlines the formal and informal steps required to advance a policy, so participants can plan and navigate the policy landscape strategically. |
|
|
 |
|
This module identifies the institutions and individuals responsible for each step, so participants can engage the right people and avoid misdirected efforts. |
|
|
 |
|
This module examines what motivates authorities to act, so participants can build and maintain the support needed to advance a policy through the system. |
|
|
 |
|
This module guides participants in designing targeted, strategic actions, so they can create momentum and accelerate policy adoption. |
|
|
 |
|
This bonus module teaches participants to craft persuasive, targeted messages so they can effectively communicate to motivate other policymakers. |
|
|
 |
|
This module orients participants to policymaking and introduces common opportunities and challenges, so participants understand how each module fits into the broader policy journey. |
|
|
 |
|
Este módulo forma parte del programa Datos a Políticas, Unidad 1 (Análisis de problemas y políticas). Tras completar este módulo, los participantes serán capaces de:
- Definir “política” e “informe de política”
- Explicar cómo se forma la política de salud
- Describir los componentes de un informe de política
Para obtener más información sobre el programa, visite https://learning.vitalstrategies.org/data-to-policy-ES |
|
|
 |
|
Este módulo forma parte del programa Datos a Políticas, Unidad 1 (Análisis de problemas y políticas). Tras completar este módulo, los participantes serán capaces de:
- Identificar diversas fuentes de datos para tu informe de política
- Utilizar PubMed para acceder a la literatura científica
- Utilizar Google Scholar y otras fuentes para acceder a la bibliografía e informes
- Utilizar términos específicos para refinar tus búsquedas
Para obtener más información sobre el programa, visite https://learning.vitalstrategies.org/data-to-policy-ES |
|
|
 |
|
Este módulo forma parte del programa Datos a Políticas, Unidad 1 (Análisis de problemas y políticas). Tras completar este módulo, los participantes serán capaces de:
- Definir la epidemiología y explicar su aplicación en la salud pública
- Definir, calcular e interpretar las medidas de frecuencia
Para obtener más información sobre el programa, visite https://learning.vitalstrategies.org/data-to-policy-ES |
|
|
 |
|
Este módulo forma parte del programa Datos a Políticas, Unidad 1 (Análisis de problemas y políticas). Tras completar este módulo, los participantes serán capaces de:
- Enmarcar un tema de política en términos de problema de salud, causa primaria y causas raíz
- Crear un diagrama de "espina de pescado" causa/efecto para analizar la(s) causa(s) raíz de un problema
- Identificar y priorizar las causas de alto impacto y modificables como objetivos de un informe de política
Para obtener más información sobre el programa, visite https://learning.vitalstrategies.org/data-to-policy-ES |
|
|
 |
|
Este módulo forma parte del programa Datos a Políticas, Unidad 1 (Análisis de problemas y políticas). Tras completar este módulo, los participantes serán capaces de:
- Desarrollar opciones de política que aborden las causas raíz
- Analizar la viabilidad de las opciones de política
- Identificar evidencia para evaluar opciones
Para obtener más información sobre el programa, visite https://learning.vitalstrategies.org/data-to-policy-ES |
|
|
 |
|
Este módulo forma parte del programa Datos a Políticas, Unidad 1 (Análisis de problemas y políticas). Tras completar este módulo, los participantes serán capaces de:
- Identificar e interpretar las medidas epidemiológicas avanzadas utilizadas en la literatura de salud pública
- Utilizar medidas epidemiológicas para comparar grupos en tu informe de política
Para obtener más información sobre el programa, visite https://learning.vitalstrategies.org/data-to-policy-ES |
|
|
 |
|
Este módulo forma parte del programa Datos a Políticas, Unidad 1 (Análisis de problemas y políticas). Tras completar este módulo, los participantes serán capaces de:
- Reconocer por qué la implementación y ejecución son importantes a considerar durante el diseño de políticas
- Identificar los diferentes mecanismos que pueden utilizarse para lograr un cambio de comportamiento
- Evaluar cuándo son apropiadas las sanciones para hacer cumplir las políticas
- Considerar cómo diversos factores podrían influir en la ejecución y el cumplimiento de tus opciones políticas
Para obtener más información sobre el programa, visite https://learning.vitalstrategies.org/data-to-policy-ES |
|
|
 |
|
Este módulo forma parte del programa Datos a Políticas, Unidad 1 (Análisis de problemas y políticas). Tras completar este módulo, los participantes serán capaces de:
- Identificar y mapear a las partes interesadas
- Priorizar y planificar las entrevistas y la participación de las partes interesadas
- Realizar el análisis de las partes interesadas
Para obtener más información sobre el programa, visite https://learning.vitalstrategies.org/data-to-policy-ES |
|
|
 |
|
Ce module fait partie du programme Données aux Politiques (D2P), unité 1 (Analyse des problèmes et des politiques). Après avoir suivi ce module, les participants seront capables de :
- Définir les termes « politique » et « exposés stratégiques
- Expliquer comment la politique de santé est élaborée
- Décrire les éléments d’exposés stratégiques
Pour plus d'informations sur le programme D2P, consultez le site https://learning.vitalstrategies.org/data-to-policy-FR/ |
|
|
 |
|
Ce module fait partie du programme Données aux Politiques (D2P), unité 1 (Analyse des problèmes et des politiques). Après avoir suivi ce module, les participants seront capables de :
- Identifier différentes sources de données pour votre exposé stratégique
- Utiliser PubMed pour accéder à la littérature scientifique
- Utiliser Google Scholar et d’autres sources pour accéder à la documentation et aux rapports
- Utiliser des termes spécifiques pour affiner vos recherches
Pour plus d'informations sur le programme D2P, consultez le site https://learning.vitalstrategies.org/data-to-policy-FR/ |
|
|
 |
|
Ce module fait partie du programme Données aux Politiques (D2P), unité 1 (Analyse des problèmes et des politiques). Après avoir suivi ce module, les participants seront capables de :
- Cadrer un sujet politique en termes de problème de santé, de cause principale et de causes profondes
- Créer un diagramme « arête de poisson » cause/effet pour analyser la ou les causes profondes d’un problème
- Identifier et hiérarchiser les causes modifiables à fort impact comme cibles d’un exposé stratégique
Pour plus d'informations sur le programme D2P, consultez le site https://learning.vitalstrategies.org/data-to-policy-FR/ |
|
|
 |
|
Ce module fait partie du programme Données aux Politiques (D2P), unité 1 (Analyse des problèmes et des politiques). Après avoir suivi ce module, les participants seront capables de :
- Élaborer des options stratégiques qui s’attaquent aux causes profondes
- Analyser la faisabilité des options stratégiques
- Identifier les éléments permettant d’évaluer les options
Pour plus d'informations sur le programme D2P, consultez le site https://learning.vitalstrategies.org/data-to-policy-FR/ |
|
|
 |
|
Ce module fait partie du programme Données aux Politiques (D2P), unité 1 (Analyse des problèmes et des politiques). Après avoir suivi ce module, les participants seront capables de :
- Identifier et cartographier les parties prenantes
- Hiérarchiser et planifier les entretiens/l’engagement des parties prenantes
- Réaliser une analyse des parties prenantes
Pour plus d'informations sur le programme D2P, consultez le site https://learning.vitalstrategies.org/data-to-policy-FR/ |
|
|
 |
|
Ce module fait partie du programme Données aux Politiques (D2P), unité 2 (Évaluation économique des politiques). Après avoir suivi ce module, les participants seront capables de :
- Définir l’évaluation économique et ses composantes
- Comprendre les avantages de l’utilisation de l’évaluation économique pour la prise de décision en matière de santé publique
- Appliquer les concepts clés de l’évaluation économique, tels que le calendrier, l’horizon analytique et la perspective, à votre thème politique
Pour plus d'informations sur le programme D2P, consultez le site https://learning.vitalstrategies.org/data-to-policy-FR/ |
|
|
 |
|
Ce module fait partie du programme Données aux Politiques (D2P), unité 2 (Évaluation économique des politiques). Après avoir suivi ce module, les participants seront capables de :
- Comprendre pourquoi les modèles sont utilisés dans le domaine de la santé publique
- Construire un modèle d’arbre décisionnel
- Calculer la valeur attendue
Pour plus d'informations sur le programme D2P, consultez le site https://learning.vitalstrategies.org/data-to-policy-FR/ |
|
|
 |
|
Ce module fait partie du programme Données aux Politiques (D2P), unité 2 (Évaluation économique des politiques). Après avoir suivi ce module, les participants seront capables de :
- Comprendre le concept de coût d’opportunité
- Définir l’analyse des coûts due programme et l’analyse des coûts de la maladie
- Développer un inventaire des coûts pour les interventions que vous proposez
Pour plus d'informations sur le programme D2P, consultez le site https://learning.vitalstrategies.org/data-to-policy-FR/ |
|
|
 |
|
Ce module fait partie du programme Données aux Politiques (D2P), unité 2 (Évaluation économique des politiques). Après avoir suivi ce module, les participants seront capables de :
- Décrire les concepts fondamentaux d’une évaluation économique complète
- Définir les méthodes d’évaluation économique les plus courantes et déterminer quand les utiliser
- Comprendre pourquoi nous actualisons les coûts et les avantages futurs
Pour plus d'informations sur le programme D2P, consultez le site https://learning.vitalstrategies.org/data-to-policy-FR/ |
|
|
 |
|
Ce module fait partie du programme Données aux Politiques (D2P), unité 2 (Évaluation économique des politiques). Après avoir suivi ce module, les participants seront capables de :
- Reconnaître l’intérêt de l’analyse de sensibilité
- Identifier et tester les données d’entrée et les hypothèses du modèle à l’aide d’une analyse de sensibilité
- Présenter les résultats de l’analyse de sensibilité
Pour plus d'informations sur le programme D2P, consultez le site https://learning.vitalstrategies.org/data-to-policy-FR/ |
|
|
 |
|
Este módulo forma parte del programa Datos a Políticas, Unidad 2 (Evaluación económica de las políticas). Tras completar este módulo, los participantes serán capaces de:
- Definir la evaluación económica y sus componentes
- Comprender los beneficios del uso de la evaluación económica para la toma de decisiones en salud pública
- Aplicar los conceptos clave de la evaluación económica, como el marco temporal, el horizonte analítico, y la perspectiva a tu tema de políticas
Para obtener más información sobre el programa, visite https://learning.vitalstrategies.org/data-to-policy-ES |
|
|
 |
|
Este módulo forma parte del programa Datos a Políticas, Unidad 2 (Evaluación económica de las políticas). Tras completar este módulo, los participantes serán capaces de:
- Comprender el concepto de costo de oportunidad
- Definir análisis de costos de programa y análisis de costos de enfermedad
- Elaborar un inventario de costos para las intervenciones propuestas
Para obtener más información sobre el programa, visite https://learning.vitalstrategies.org/data-to-policy-ES |
|
|
 |
|
Este módulo forma parte del programa Datos a Políticas, Unidad 2 (Evaluación económica de las políticas). Tras completar este módulo, los participantes serán capaces de:
- Describir los conceptos básicos de una evaluación económica completa
- Definir los métodos de evaluación económica más comunes e identificar cuándo utilizarlos
- Entender por qué descontamos costos y beneficios futuros
Para obtener más información sobre el programa, visite https://learning.vitalstrategies.org/data-to-policy-ES |
|
|
 |
|
Este módulo forma parte del programa Datos a Políticas, Unidad 2 (Evaluación económica de las políticas). Tras completar este módulo, los participantes serán capaces de:
- Reconocer el valor del análisis de sensibilidad
- Identificar y probar las variables de entrada y las hipótesis del modelo mediante el análisis de sensibilidad
- Presentar los resultados del análisis de sensibilidad
Para obtener más información sobre el programa, visite https://learning.vitalstrategies.org/data-to-policy-ES |
|
|
 |
|
Este módulo forma parte del programa Datos a Políticas, Unidad 2 (Evaluación económica de las políticas). Tras completar este módulo, los participantes serán capaces de:
- Comprender por qué se utilizan modelos en la salud pública
- Construir un modelo de árbol de decisión
- Calcular el valor esperado
Para obtener más información sobre el programa, visite https://learning.vitalstrategies.org/data-to-policy-ES |
|
|
 |
|
Este módulo forma parte del programa Datos a Políticas, Unidad 1 (Análisis de problemas y políticas). Tras completar este módulo, los participantes serán capaces de:
- Describir cómo afecta el género al estado de salud, así como al entorno político
- Utilizar el análisis de género para analizar un problema de salud y las opciones políticas
Para obtener más información sobre el programa, visite https://learning.vitalstrategies.org/data-to-policy-ES |
|
|
 |
|
Este módulo forma parte del programa Datos a Políticas, Unidad 3 (Promoción de políticas y comunicaciones). Tras completar este módulo, los participantes serán capaces de:
- Escribir para tu público o partes interesadas
- Conocer los errores gramaticales y sintácticos más comunes que debes evitar
- Comprender las técnicas que se pueden utilizar para redactar frases y párrafos claros y concisos
Para obtener más información sobre el programa, visite https://learning.vitalstrategies.org/data-to-policy-ES |
|
|
 |
|
Este módulo forma parte del programa Datos a Políticas, Unidad 3 (Promoción de políticas y comunicaciones). Tras completar este módulo, los participantes serán capaces de:
- Identificar la información que debe incluirse en el planteamiento del problema
- Proporcionar información relevante sobre el planteamiento de un problema
Para obtener más información sobre el programa, visite https://learning.vitalstrategies.org/data-to-policy-ES |
|
|
 |
|
Este módulo forma parte del programa Datos a Políticas, Unidad 3 (Promoción de políticas y comunicaciones). Tras completar este módulo, los participantes serán capaces de:
- Resumir intervenciones eficaces, teniendo en cuenta todos los aspectos de la viabilidad
- Exponer visualmente las opciones de forma que se destaque claramente una opción sobre las demás
- Evaluar las opciones de política en los informes
Para obtener más información sobre el programa, visite https://learning.vitalstrategies.org/data-to-policy-ES |
|
|
 |
|
Este módulo forma parte del programa Datos a Políticas, Unidad 3 (Promoción de políticas y comunicaciones). Tras completar este módulo, los participantes serán capaces de:
- Identificar los componentes de una buena recomendación
- Redactar una recomendación y un llamado a la acción convincentes
Para obtener más información sobre el programa, visite https://learning.vitalstrategies.org/data-to-policy-ES |
|
|
 |
|
Este módulo forma parte del programa Datos a Políticas, Unidad 3 (Promoción de políticas y comunicaciones). Tras completar este módulo, los participantes serán capaces de:
- Identificar las visualizaciones más adecuadas para narrar historias con datos
- Identificar los tipos y las limitaciones del mapeo de datos de salud
- Utilizar lineamientos para crear visualizaciones efectivas para tus informes de política y presentaciones
Para obtener más información sobre el programa, visite https://learning.vitalstrategies.org/data-to-policy-ES |
|
|
 |
|
Este módulo forma parte del programa Datos a Políticas, Unidad 3 (Promoción de políticas y comunicaciones). Tras completar este módulo, los participantes serán capaces de:
- Describir en qué consiste una buena sección de mensajes clave
- Reducir el contenido del informe a 2 o 3 mensajes claves
- Describir un buen título
- Elaborar un título eficaz para tu informe
Para obtener más información sobre el programa, visite https://learning.vitalstrategies.org/data-to-policy-ES |
|
|
 |
|
Este módulo forma parte del programa Datos a Políticas, Unidad 3 (Promoción de políticas y comunicaciones). Tras completar este módulo, los participantes serán capaces de:
- Analizar el entorno político y de promoción
- Describir formas para abogar por el cambio de políticas
- Presentar tu informe político en PowerPoint de forma eficaz
- Desarrollar un “discurso de ascensor” eficaz
Para obtener más información sobre el programa, visite https://learning.vitalstrategies.org/data-to-policy-ES |
|
|
 |
|
Ce module fait partie du programme Données aux Politiques (D2P), unité 1 (Analyse des problèmes et des politiques). Après avoir suivi ce module, les participants seront capables de :
- Décrire comment le genre influe sur l’état de santé ainsi que sur l’environnement politique
- Utiliser l’analyse de genre pour analyser un problème de santé et les options stratégiques
Pour plus d'informations sur le programme D2P, consultez le site https://learning.vitalstrategies.org/data-to-policy-FR/ |
|
|
 |
|
Ce module fait partie du programme Données aux Politiques (D2P), unité 1 (Analyse des problèmes et des politiques). Après avoir suivi ce module, les participants seront capables de :
- Définir l’épidémiologie et expliquer son application dans le domaine de la santé publique
- Définir, calculer et interpréter les mesures de fréquence
Pour plus d'informations sur le programme D2P, consultez le site https://learning.vitalstrategies.org/data-to-policy-FR/ |
|
|
 |
|
Ce module fait partie du programme Données aux Politiques (D2P), unité 1 (Analyse des problèmes et des politiques). Après avoir suivi ce module, les participants seront capables de :
- Identifier et interpréter les mesures épidémiologiques avancées utilisées dans la littérature sur la santé publique
- Utiliser des mesures épidémiologiques pour comparer les groupes dans votre exposé stratégique
Pour plus d'informations sur le programme D2P, consultez le site https://learning.vitalstrategies.org/data-to-policy-FR/ |
|
|
 |
|
Ce module fait partie du programme Données aux Politiques (D2P), unité 1 (Analyse des problèmes et des politiques). Après avoir suivi ce module, les participants seront capables de :
- Comprendre pourquoi il est important de prendre en compte la mise en œuvre et l’application lors de la conception des politiques
- Identifier les différents mécanismes pouvant être utilisés pour obtenir un changement de comportement
- Évaluer quand les sanctions sont appropriées pour l’application des politiques
- Examiner comment divers facteurs pourraient influencer la mise en œuvre et l’application de vos options stratégiques
Pour plus d'informations sur le programme D2P, consultez le site https://learning.vitalstrategies.org/data-to-policy-FR/ |
|
|
 |
|
Ce module fait partie du programme Données aux Politiques (D2P), unité 3 (Promotion des politiques et communication). Après avoir suivi ce module, les participants seront capables de :
- Écrire pour votre public ou vos parties prenantes
- Être conscient des erreurs courantes de grammaire et de syntaxe à éviter
- Comprendre les techniques permettant de rédiger des phrases et des paragraphes clairs et concis
Pour plus d'informations sur le programme D2P, consultez le site https://learning.vitalstrategies.org/data-to-policy-FR/ |
|
|
 |
|
Ce module fait partie du programme Données aux Politiques (D2P), unité 3 (Promotion des politiques et communication). Après avoir suivi ce module, les participants seront capables de :
- Identifier les types de visualisation les plus appropriés pour vos récits de données
- Identifier les types et les limites de la cartographie des données de santé
- Utiliser les directives pour créer les visualisations les plus efficaces pour votre expose stratégique et vos présentations
Pour plus d'informations sur le programme D2P, consultez le site https://learning.vitalstrategies.org/data-to-policy-FR/ |
|
|
 |
|
Ce module fait partie du programme Données aux Politiques (D2P), unité 3 (Promotion des politiques et communication). Après avoir suivi ce module, les participants seront capables de :
- Identifier les informations qui doivent figurer dans votre énoncé du problème
- Fournir des commentaires pertinents sur un énoncé du problème
Pour plus d'informations sur le programme D2P, consultez le site https://learning.vitalstrategies.org/data-to-policy-FR/ |
|
|
 |
|
Ce module fait partie du programme Données aux Politiques (D2P), unité 3 (Promotion des politiques et communication). Après avoir suivi ce module, les participants seront capables de :
- Résumer les interventions efficaces, en tenant compte de tous les aspects de la faisabilité
- Présenter visuellement les options de manière à mettre clairement en avant l’une d’entre elles par rapport aux autres
- Évaluer les sections consacrées aux options stratégiques dans les exposés
Pour plus d'informations sur le programme D2P, consultez le site https://learning.vitalstrategies.org/data-to-policy-FR/ |
|
|
 |
|
Ce module fait partie du programme Données aux Politiques (D2P), unité 3 (Promotion des politiques et communication). Après avoir suivi ce module, les participants seront capables de :
- Identifier les éléments constitutifs d’une bonne recommandation
- Rédiger une recommandation convaincante et un appel à l’action
Pour plus d'informations sur le programme D2P, consultez le site https://learning.vitalstrategies.org/data-to-policy-FR/ |
|
|
 |
|
Ce module fait partie du programme Données aux Politiques (D2P), unité 3 (Promotion des politiques et communication). Après avoir suivi ce module, les participants seront capables de :
- Décrire les éléments d’un bon message clé
- Résumer le contenu de votre exposé stratégique en 2 ou 3 messages clés
- Décrire ce qui fait un bon titre
- Élaborer un titre efficace pour ton exposé stratégique
Pour plus d'informations sur le programme D2P, consultez le site https://learning.vitalstrategies.org/data-to-policy-FR/ |
|
|
 |
|
Ce module fait partie du programme Données aux Politiques (D2P), unité 3 (Promotion des politiques et communication). Après avoir suivi ce module, les participants seront capables de :
- Analyser l'environnement politique et de plaidoyer
- Décrire les moyens dont vous disposez pour plaider en faveur d’un changement de politique
- Présenter efficacement votre exposé en utilisant PowerPoint
- Élaborer un argumentaire éclair et efficace
Pour plus d'informations sur le programme D2P, consultez le site https://learning.vitalstrategies.org/data-to-policy-FR/ |
|
|